

2021 Was Another Record Breaking Year For Mackinac Bridge Traffic
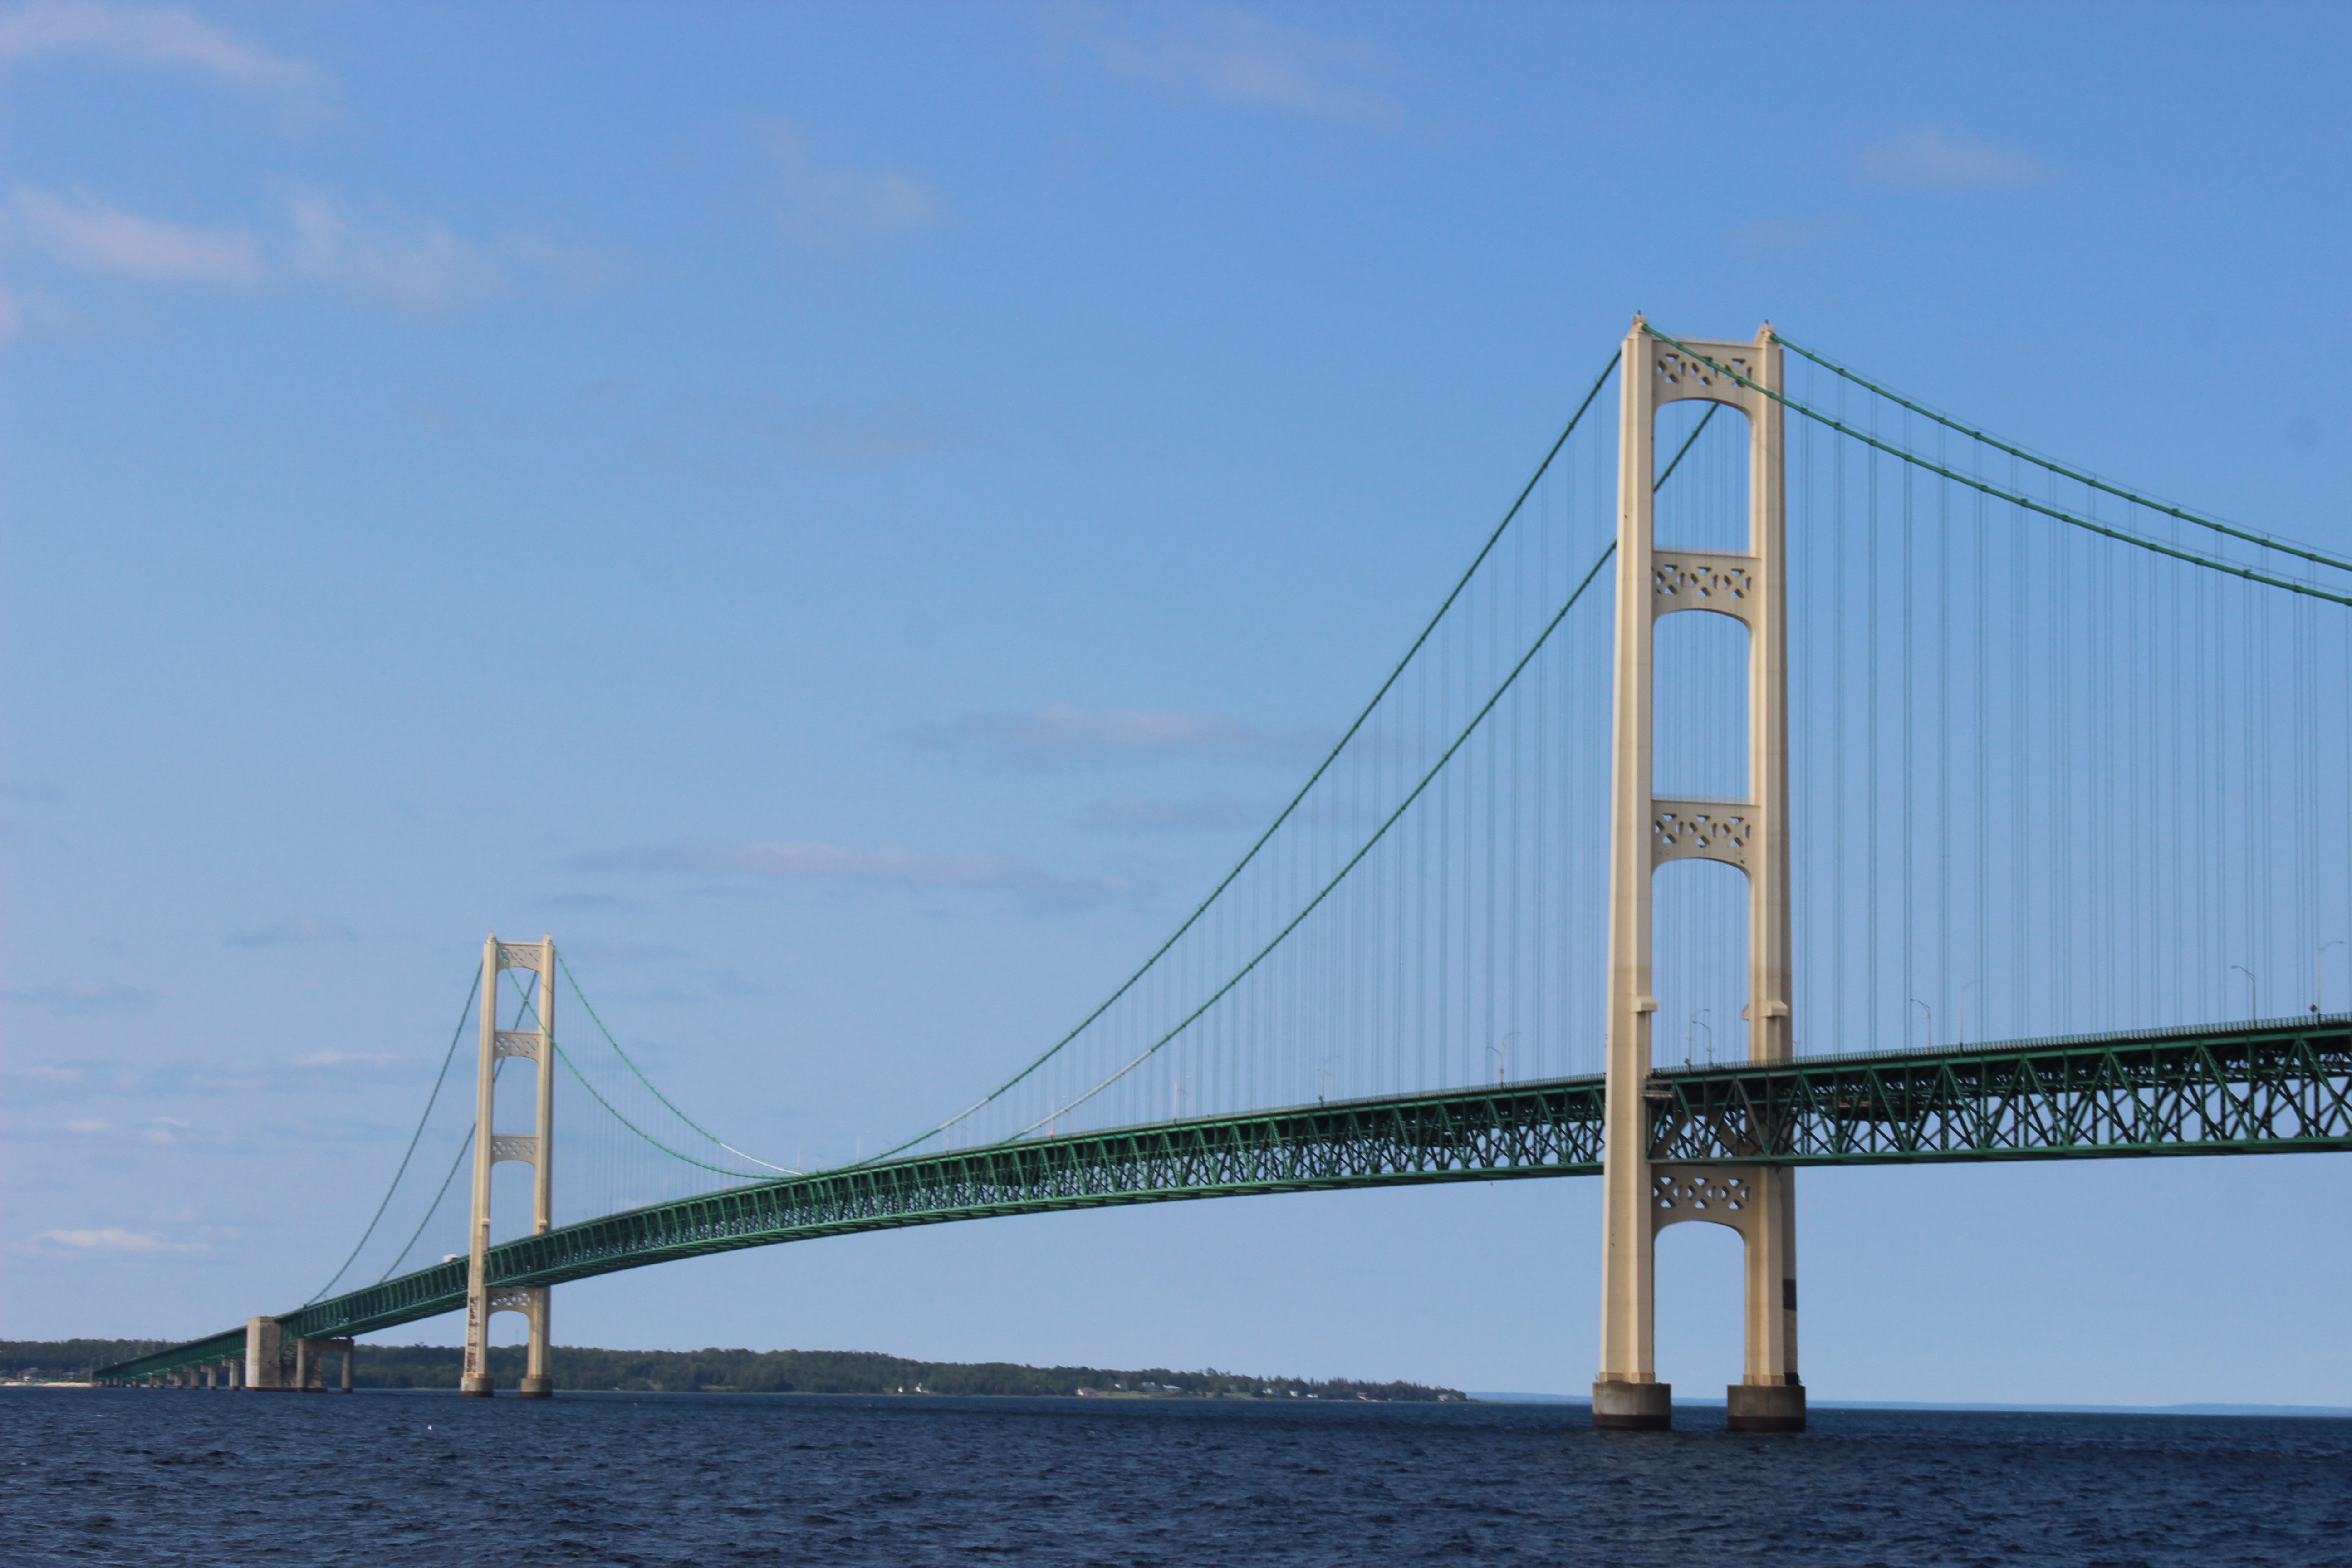
The Mackinac Bridge has been an iconic Michigan landmark since 1957, connecting the Lower Peninsula to the Upper Peninsula and providing millions of travelers one of the most scenic five mile drives in the state. The Mackinac Bridge Authority recently posted final statistics for December of 2021 so we can now go back and take a look at what was a record breaking year. Since the bridge has made a few headlines recently for scary things like a crash that left a truck hanging on the side of the railing and a 12 foot trailer that tipped over during a high wind advisory, it seemed like a good time to highlight some good news about Michigan’s favorite bridge. With 4,386,466 vehicle crossings in 2021, the Mackinac Bridge had a 16.8% increase from 2020 and a 3.72% increase over 2019 which was its previous busiest year. 2021 also saw a new single month record, which we will look at below. Overall, it was great to see numbers rebound after COVID-19 slowed things down in 2020. Here’s a look at our deep dive into the numbers provided by the Mackinac Bridge Authority at https://www.mackinacbridge.org.
Monthly traffic statistics are provided online going back to 2014, so let’s take a look at how the last eight years have gone:
2021 – 4,386,466
2020 – 3,753,392
2019 – 4,228,973
2018 – 4,177,518
2017 – 4,154,549
2016 – 4,069,572
2015 – 3,914,361
2014 – 3,634,621

The variance in 2020 is easily explained by COVID-19 travel restrictions. With that lone exception there has been an increase in bridge traffic each year. Now let’s look at how the year broke down month by month:
January – 186,538
February – 200,326
March – 229,227
April – 257,000
May – 360,956
June – 476,110
July – 641,696
August – 623,250
September – 499,255
October – 433,063
November – 267,242
December – 211,803
Other than January and February every month saw an increase from 2020 and most numbers were close to their 2019 counterparts. July (1st) and August (3rd) were top all-time months for bridge traffic. The summer months saw 1,741,056 vehicle crossings, which was almost 40% of the entire year’s traffic.
For more Mackinac Bridge coverage check out our 60 Fun Facts About the Mackinac Bridge article for its 60th Anniversary in 2017, our 2021 article about how you can bid on pieces of the Mackinac Bridge at auction, and a look at 6 Great Places to View the Mackinac Bridge.