
2023 Was Another Record Traffic Year For The Mackinac Bridge
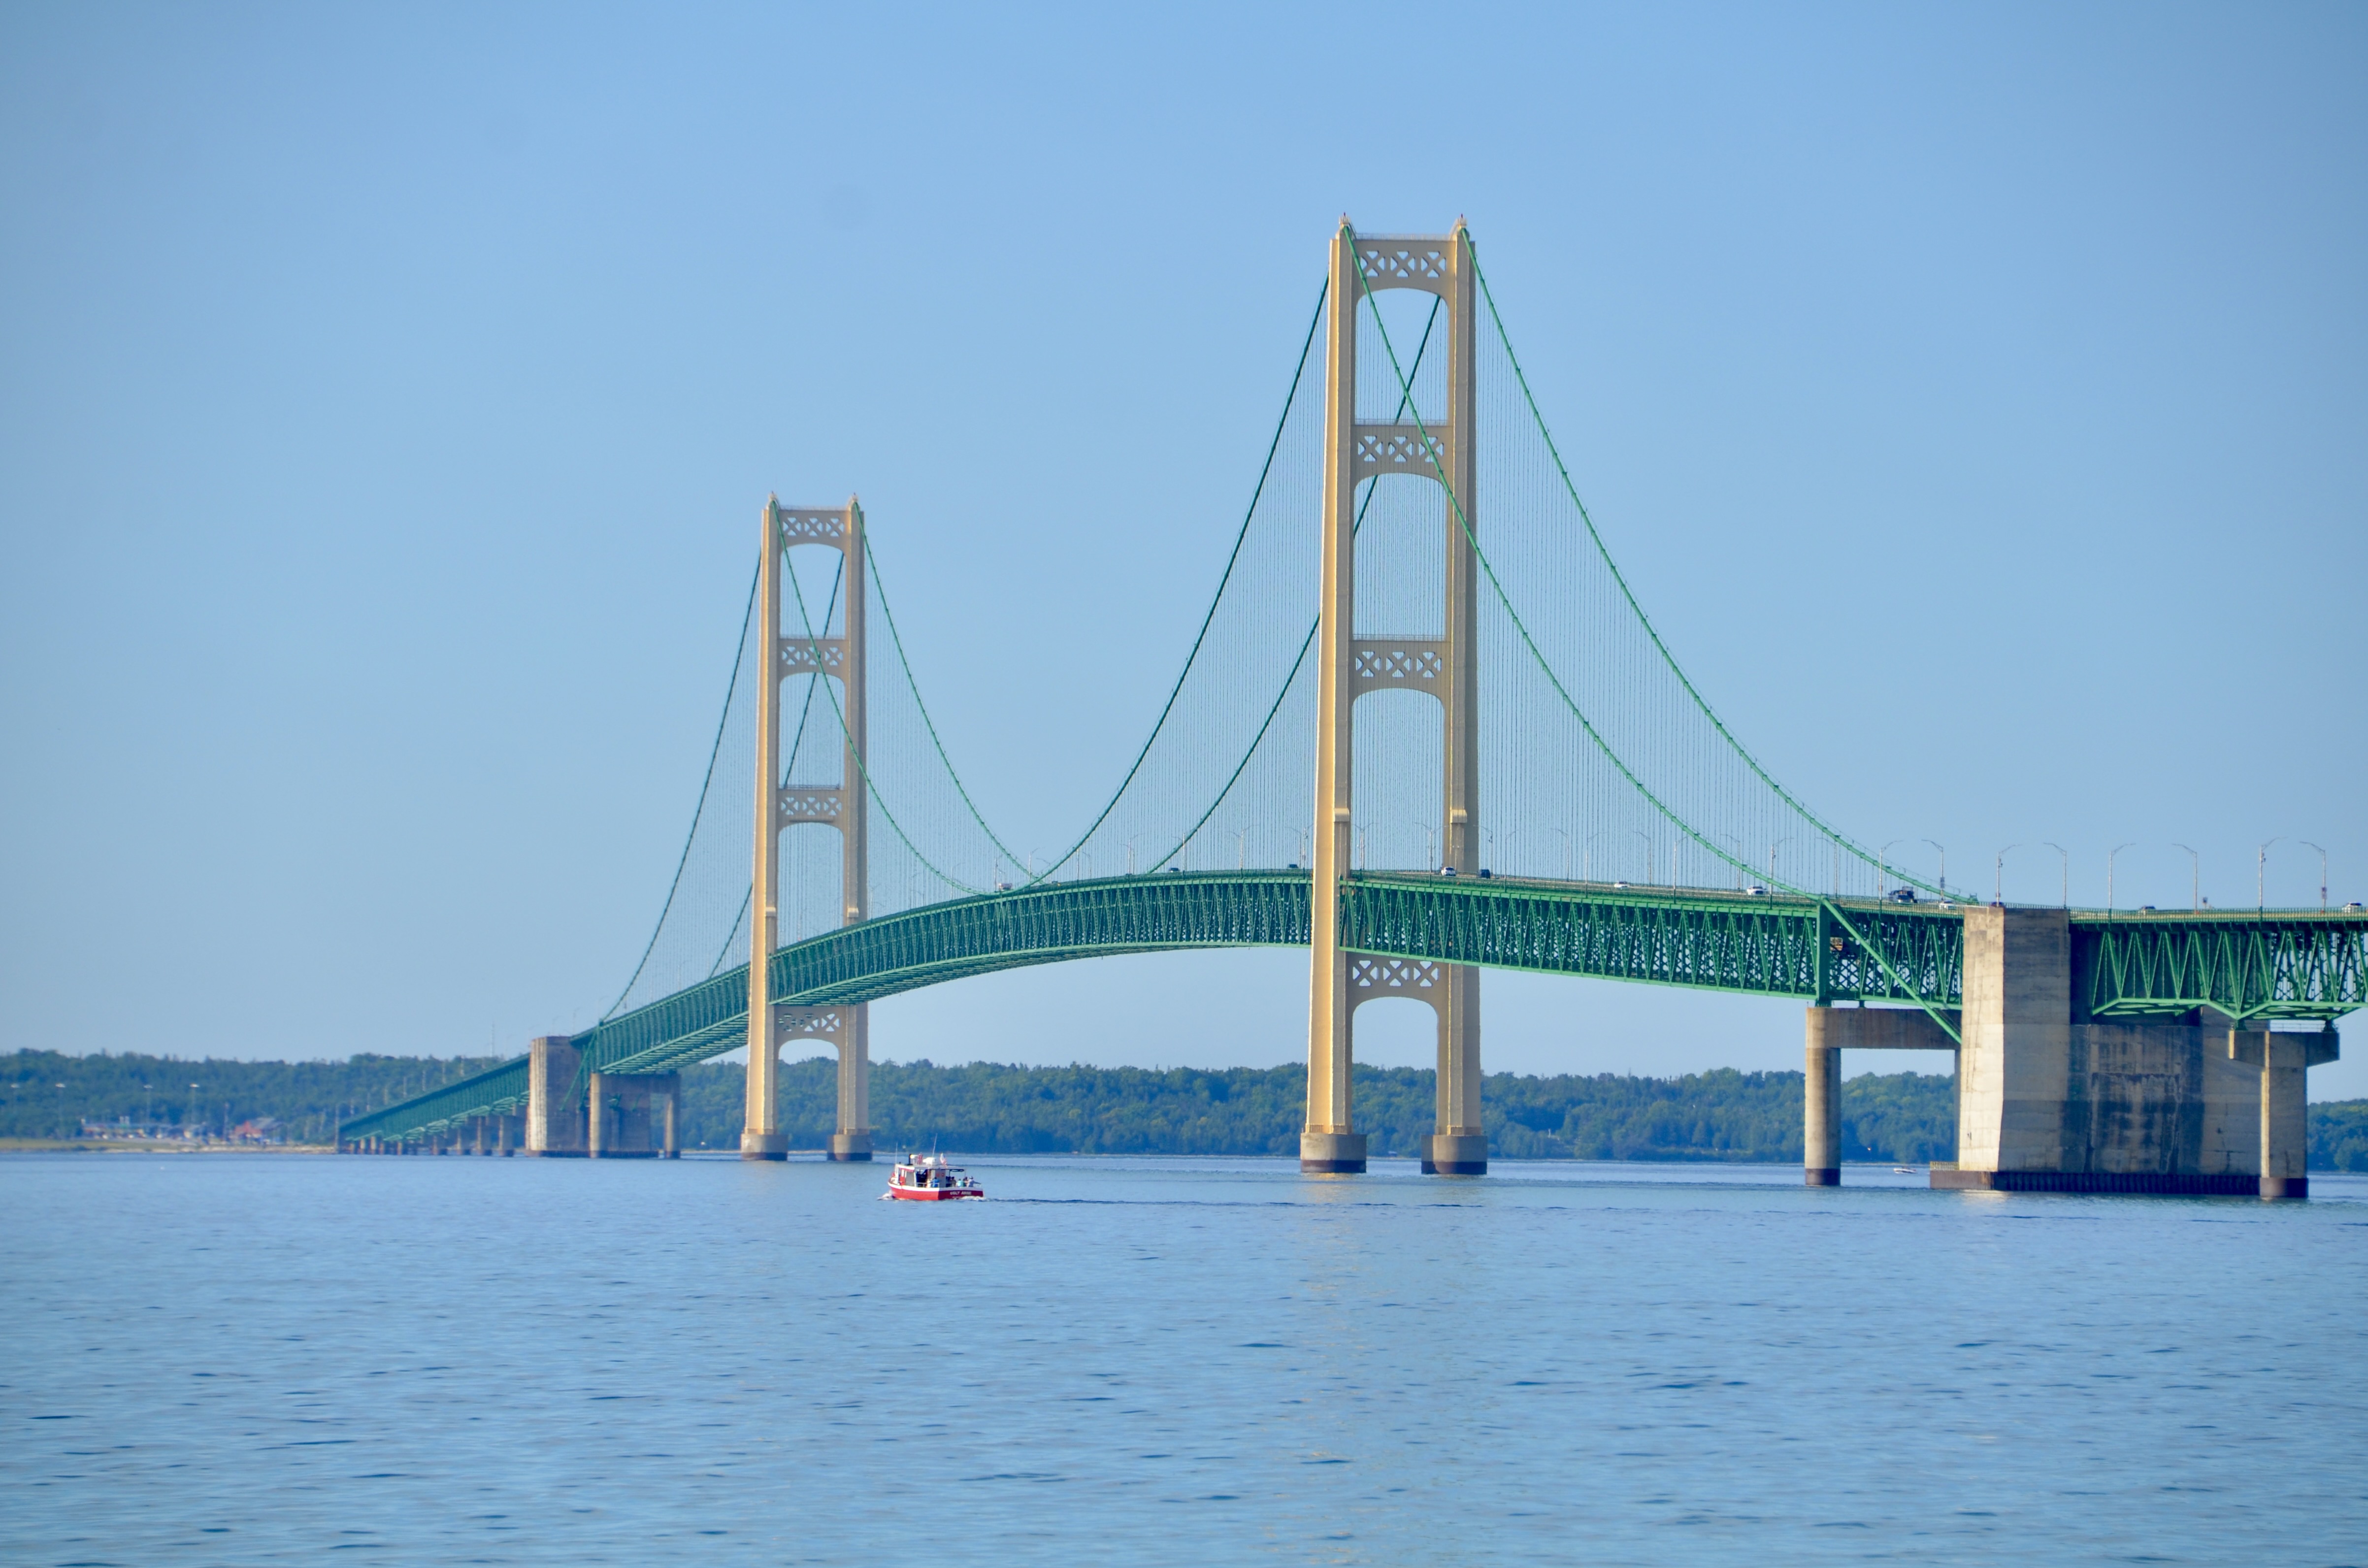
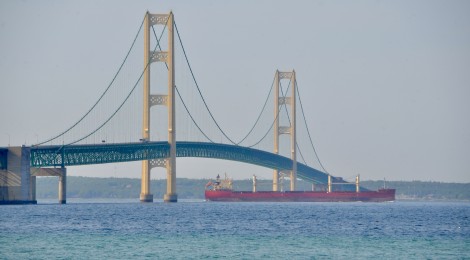
The Mackinac Bridge is one of Michigan’s most recognizable landmarks and a vital piece of highway infrastructure that connects our two peninsulas. Since 1957 it has carried I-75 for five miles across the Straits of Mackinac. It is the longest bridge of its kind in the Western Hemisphere and hundreds of thousands of visitors capture photographs of it each year from St. Ignace, Mackinaw City, and Mackinac Island. The Mackinac Bridge Authority posts statistics for every month of the year and we always enjoy looking to see how busy the bridge was or if there were any significant changes in travel patterns. Now that final numbers for 2023 are posted we can look back at what was another record traffic year for the “Mighty Mac” and what it means for the future. The sole source of funding for the bridge is tolls and fees, so an increase in traffic and tolls means money is available for the ongoing maintenance that keeps this landmark in great shape.

The final traffic count for 2023 was 4,456,148 vehicle crossings. This was an increase of more than 200,000 vehicle crossings from 2022 and beat out the previous record set in 2021 by more than 100,000 vehicle crossings. More than half the months in 2023 saw all-time high marks. Here’s a look at the previous decade’s numbers:
2022 – 4,207,983
2021 – 4,386,466
2020 – 3,753,392
2019 – 4,228,973
2018 – 4,177,518
2017 – 4,154,549
2016 – 4,069,572
2015 – 3,914,361
2014 – 3,634,621

The first part of the year saw a few strong months, as January, April, and May set monthly records. Each of the first five months except February saw an increase in traffic from the prior year.
January – 215,779
February – 211.883
March – 230,852
April – 243,970
May – 369,525

The summer months are always the busiest at the Mackinac Bridge, as people travel north to vacation destinations like Pictured Rocks National Lakeshore, Tahquamenon Falls, Marquette, the Keweenaw Peninsula, and more before heading home. June traffic was an all-time high for that month, while July’s traffic count made it the third-busiest single month since statistics have been tracked. August of 2023 saw roughly 30,000 more vehicle crossings than the previous year, but was still 23,000 short of the August mark for 2021.
June – 492,976
July – 638,241
August – 616,587

After a busy summer you might wonder if fall and early winter could maintain the same pace. They sure did, as September and October’s strong numbers were just short of the best ever numbers for those months and then November and December set all-time high marks for those months. It was quite a strong finish for the year as December traffic was up 13% from the previous year, likely helped along by a surprisingly mild start to winter.
September – 498,563
October – 429,239
November – 277,965
December – 230,568

It’s always great to see Mackinac Bridge traffic stay strong, as it means more and more people are exploring everything our Upper Peninsula has to offer. Strong traffic numbers means strong revenue, which will keep our beloved Mackinac Bridge in great shape for many more years to come!